Lua Debugging
04/27/21 07:50 Filed in: Lua
I'm using Lua in various ways. I'm playing around with an environment, Codea, and need a way to debug my code. Today, I try to find an answer that works in Lua.
Lua Has No Debugger
The first thing I discovered is there is no debugging capability built into Lua itself. This is because Lua is meant to be small and embeddable. Instead, it has a library that allows you to implement debugging. To me, this isn't the optimal solution, but I work with what I have and know.
I guess, I have to reinvent the wheel, to a certain extent. Let's get to it!
getinfo
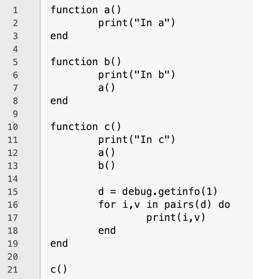
Lua's debug library has a function, getinfo, which lets you examine the running code. The basic syntax is:
table = debug.getinfo(number, [filter])
Where number is an integer; getinfo will look up the call stack that number of steps. Filter is an optional parameter that allows you to filter out certain items that getinfo needs to scan. This, apparently, is a way to speed up getinfo. getinfo returns a table. It appears getinfo deals with functions at its core. I think I need to try a very simple program and see what getinfo returns.
And the results (I've edited out the non getinfo stuff.)
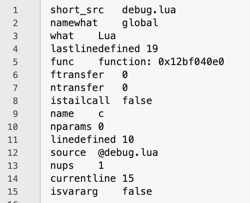
Some of this is understandable:
- short_src is my source file name.
- what is the language (Lua). I guess it can also print the language in which Lua has been embedded.
- lastlinedefined is the number of lines in the source file.
- func appears to be the address of the function in memory.
- name is "c" here, the name of my function.
- nparams is the number of parameters to my func c().
- line defined is source file's line number where my function is defined.
- source is also my file name. I'm not sure what the difference is, or what the @ represents in this case.
- nups is 1 here. I think it is the number of stack steps "up" I've specified as an argument to getinfo.
- currentline is the line where getinfo is called.
- isvararg is an indicator if my func c() is varied. That's my guess.
This is not what I think of when I think of debugging a program. This is what I think of when I want a crossref (cross reference) listing.
getlocal
Another function in the debug library is getlocal which lets you examine local variables. The syntax is:
name, value = debug.getlocal(number, index)
Where number has the same meaning as getinfo, and index is the numerical sequence of the local variable in the function. Variables are indexes in the order they appear in the function. It's time for an example.
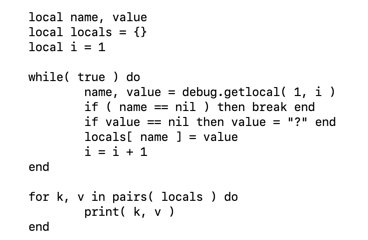
This program creates some local variables, then enters a loop. Inside the loop I use getlocal to iterate over all the local variables. I pass in (1,i) and increment i until the call returns nil (no local variable). The name and value are stored in the local variable locals. Finally, I just dump the table of locals.
This is what happens when I run it.
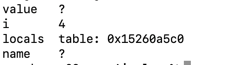
What does this mean? i found 4 locals. The variables value and name don't have a value (nil) when they are scanned. And locals is a table that actually holds all the locals. But, I just dumped locals. What happens if I dump the locals in locals? I get the same thing. It's recursive! Ack! The solution is to not make locals a local. There is no real reason to include it in getlocal.
Summary
I covered a lot of information, but most of it still doesn't feel like debugging to me. At this point, I still think just using a print() statement is easier and more understandable. I'll keep delving into the debug library next time, and hopefully I can see how all of this is useful when debugging.